Simulation-guided cohort selection for a polyherbal weight-management trial
Choosing The Trial Population
Cohort choice alone moves the participants needed by 1.8×
0.83×
1.52×
of the reference cohort of the reference cohort
- Obese, men only
- Obese, mixed sex, 46-65
fewest participants needed most participants needed
Himalaya AyurSlim, one 2-capsule dose | 6 virtual cohorts of 100 | Asian reference population | fed state
Bottom Line
Enrol obese, men only, 25-45 y; avoid obese, mixed sex, 46-65 y
Across the 13 targets that carry a per-subject spread, Obese, men only, 25-45 y gives the largest separation between the formula and its comparator on 12 of them, and Obese, mixed sex, 46-65 y the smallest on 13. That is a consistent answer rather than a single endpoint's verdict.
- Cohort choice moves the participants needed by about 1.8x on after-meal blood sugar: 0.83 of the reference cohort in obese, men only, 25-45 y, 1.52 in obese, mixed sex, 46-65 y.
| Primary endpoint | Proteins scored | Best cohort |
|---|---|---|
| Appetite and fullness | GLP-1 receptor | Obese, women only, 25-45 y |
| After-meal blood sugar | DPP-4, GLP-1 receptor, GPR119, SGLT1 | Obese, men only, 25-45 y |
| Fat stored in the liver | ACC1 | Obese, men only, 25-45 y |
- The oldest cohort is the clearest finding. It is last on every target that carries a per-subject spread, so an older population costs subjects whichever endpoint is primary.
- Engagement follows the concentration a cohort reaches, but not the fraction it absorbs. Absorption runs up to 31 per cent above the reference cohort while peak levels barely move: obese, men only, 25-45 y absorbs 1.31 times the reference and reaches only 1.09 times the peak, for 1.10 times the engagement, because the extra is distributed into more body.
- Recruitment pulls against the ranking: obese, men only, 25-45 y needs 15.3 candidates screened per subject randomised, against 1.5 for the reference cohort.
The Question
A nutraceutical trial usually fails for one of two reasons. Either the product does not work, or it was tested in people in whom it could not have shown a difference. The second failure is expensive and avoidable, and it is invisible in the protocol: the inclusion criteria look reasonable, the study is powered off a literature effect size borrowed from a different formulation in a different population, and the result is a null trial that tells the sponsor nothing about their product.
Enrichment is the standard answer, and every experienced CRO already does a version of it from clinical judgment and published trials. What has been missing is a formula-specific, quantitative input to that judgment: a way to ask, before anyone is screened, in which cohort this particular product reaches its targets most and varies least.
This report answers that question for a marketed Indian polyherbal weight-management formula, chosen because its composition is public and every input can be checked.
How This Was Produced
The formula was dosed into 6 virtual cohorts of 100 subjects each. Every cohort is an independent population in which
- Choosing The Trial Population
- body weight, height, organ volumes, fat mass, kidney filtration and organ blood flow are drawn per subject, so an obese
cohort genuinely carries more fat and clears differently rather than being an average adult with a different label. Each subject is then simulated individually: the formula is absorbed, distributed, metabolised and cleared through a whole-body model, and the resulting concentration is read at the place each protein actually acts.
| What was varied | What was held identical |
|---|---|
| Age, sex and BMI band, across six cohorts | Dose, formulation, particle size, target panel, potencies, meal state |
Table 1. One variable moves across the study. That is what makes a difference between cohorts attributable to the population rather than to the formula or the method.
Alongside the formula, every cohort received a comparator: Garcinia cambogia extract alone, matched hydroxycitric acid dose. It is the hero ingredient alone, at the same dose, in the same capsule, with the other four botanicals removed, standing in for a trial whose control arm is an active ingredient rather than placebo.
Doses come from the manufacturer’s regulated European label, which declares the daily portion of four capsules ingredient by ingredient and distinguishes dry extracts from powdered resin. That distinction fixes the dissolution behaviour each ingredient is entitled to. The Indian label declares the same five botanicals per capsule at 300 / 70 / 10 / 10 / 10 mg, which multiplies to the European totals exactly, so two independently regulated markets corroborate the same composition.
One 2-capsule dose was simulated, taken after food, exactly as the label instructs, and scored over the 12 hours to the next dose.
| Marker | Declared ingredient | mg per dose |
|---|---|---|
| Hydroxycitric acid | Garcinia cambogia dry fruit extract | 300 |
| E-Guggulsterone | Balsamodendron mukul purified powdered resin | 1.75 |
| Z-Guggulsterone | Balsamodendron mukul purified powdered resin | 1.75 |
| Gymnemic acid I | Gymnema sylvestre dry leaf extract | 3.5 |
| Gymnemagenin | Gymnema sylvestre dry leaf extract | 1.5 |
| Chebulinic acid | Terminalia chebula dry fruit extract | 3.15 |
| Chebulagic acid | Terminalia chebula dry fruit extract | 3.15 |
| Diosgenin | Trigonella foenum-graecum dry seed extract | 10 |
Table 2. Simulated dose per marker, one 2-capsule dose, half the four-capsule daily serving.
The Six Cohorts
Each cohort is an independent virtual population. Body weight, height, organ volumes, fat mass, renal filtration and organ perfusion are sampled per subject, so an obese cohort genuinely carries more adipose volume and a different clearance distribution rather than being a relabelled average adult. BMI bands follow the WHO Asia-Pacific cut-offs used in Indian practice, not the 25/30 international ones.
| Cohort | Varies | n | BMI mean (range) | Age mean | Weight kg |
|---|---|---|---|---|---|
| Normal weight, mixed sex, 25-45 y | reference | 94 | 20.8 (18.5-22.8) | 35.8 | 55.3 |
| Overweight, mixed sex, 25-45 y | bmi ladder | 94 | 23.9 (23.0-24.9) | 34.5 | 62.7 |
| Obese, mixed sex, 25-45 y | bmi ladder | 94 | 26.9 (25.0-34.9) | 36.2 | 70.3 |
| Obese, women only, 25-45 y | sex | 94 | 27.6 (25.1-33.3) | 34.8 | 65.6 |
| Obese, men only, 25-45 y | sex | 94 | 26.8 (25.0-31.8) | 34.8 | 76.6 |
| Obese, mixed sex, 46-65 y | age | 94 | 27.2 (25.0-33.4) | 55.8 | 69.2 |
Table 3. Composition as delivered. A BMI band is met by filtering generated candidates, so the realised cohort is an outcome of that filter rather than of the request, and is reported as such.
Clinical Endpoints, Cohort By Cohort
These are the measures a trial would read out. Each is mapped to the proteins that carry it and each is ranked on its own.
Values compare cohorts within one endpoint and never across endpoints: two endpoints on different exposure scales are different quantities and are combined nowhere in this report.
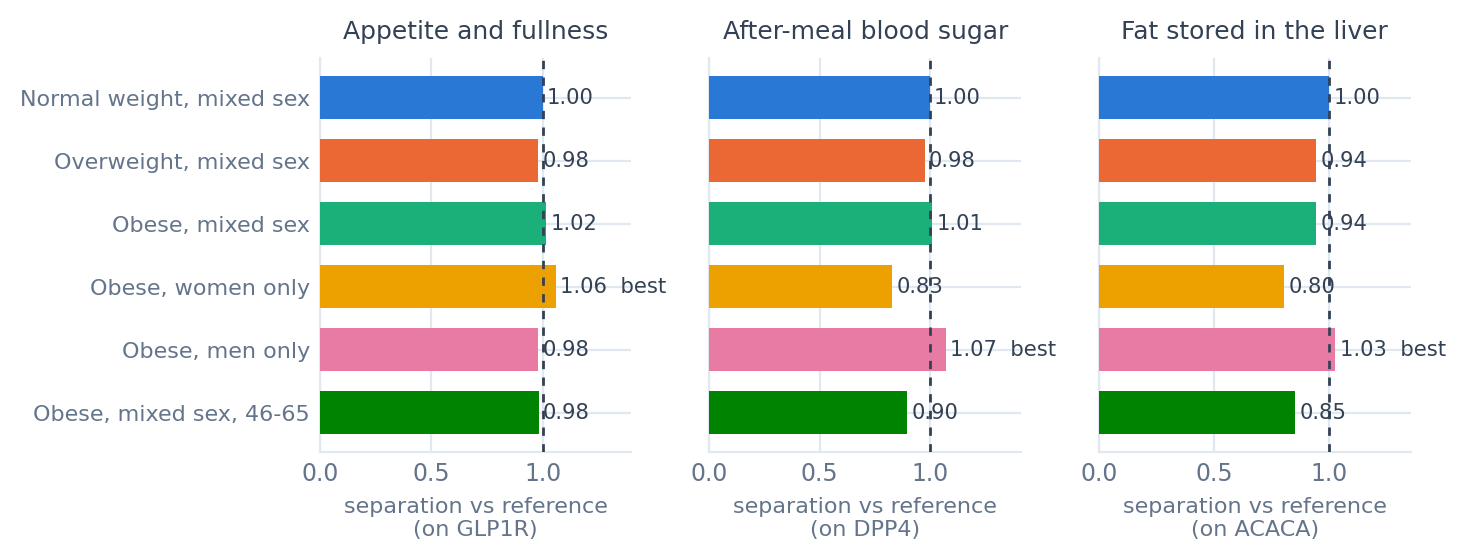
Figure 1. How far each cohort separates the formula from its single-ingredient comparator, relative to the reference cohort, for each clinical endpoint. Three endpoints, three different best cohorts.
Appetite and fullness
How strongly a formula engages the gut-hormone receptor through which medicines reduce hunger, increase fullness and lower how much people eat.
- ad libitum energy intake at a test meal (controlled laboratory meal) - benefit: decrease
- hunger, fullness and control-of-eating ratings (visual analogue scale / Control of Eating Questionnaire) - benefit: decrease in hunger, increase in fullness
- What a trial would measure
- Scored over 0-6 h after the dose. Best cohort: Obese, women only, 25-45 y, averaged over its single protein.
| Protein | Wanted | Scored at | Normal | Overweight | Obese | Obese F | Obese M | Obese 46-65 |
|---|---|---|---|---|---|---|---|---|
| GLP-1 receptor | activate | pancreatic tissue | 1.00 | 0.99 | 1.01 | 0.93 | 1.01 | 0.99 |
Table. Each cohort column is that protein's engagement relative to the reference cohort, which is 1.00 by construction; bold marks the strongest of the other five. The proteins act in different places, so their columns are read down and never averaged across.
Not scored here: DPP-4. Sits in a mechanism that feeds this endpoint but has no human evidence tying the receptor itself to this measure, so it is reported under its mechanism rather than counted in the cohort standing.
- After-meal blood sugar
- How strongly a formula engages the mechanisms through which medicines blunt the rise in blood sugar after a meal.
- postprandial plasma glucose excursion after a standardised meal (serial venous plasma glucose) - benefit: decrease
- 2-hour plasma glucose after an oral glucose load (oral glucose tolerance test) - benefit: decrease
- What a trial would measure
- Scored over 0-4 h after the dose. Best cohort: Obese, men only, 25-45 y, averaged over all 4 proteins.
| Protein | Wanted | Scored at | Normal | Overweight | Obese | Obese F | Obese M | Obese 46-65 |
|---|---|---|---|---|---|---|---|---|
| DPP-4 | inhibit | free level in blood | 1.00 | 0.99 | 1.03 | 0.82 | 1.10 | 0.97 |
| GLP-1 receptor | activate | pancreatic tissue | 1.00 | 0.99 | 1.02 | 0.93 | 1.02 | 0.99 |
| GPR119 | activate | gut surface | 1.00 | 0.99 | 1.03 | 0.89 | 1.06 | 0.98 |
| SGLT1 | inhibit | gut surface | 1.00 | 0.99 | 1.05 | 0.86 | 1.10 | 0.97 |
Table. Each cohort column is that protein's engagement relative to the reference cohort, which is 1.00 by construction; bold marks the strongest of the other five. The proteins act in different places, so their columns are read down and never averaged across.
Not scored here: FFAR2, TGR5. Sits in a mechanism that feeds this endpoint but has no human evidence tying the receptor itself to this measure, so it is reported under its mechanism rather than counted in the cohort standing.
Fat stored in the liver
How strongly a formula engages the fat-synthesis enzyme whose inhibition reduced liver fat in human trials.
- liver fat content (MRI proton density fat fraction) - benefit: decrease
- hepatic de novo lipogenesis (stable-isotope labelling) - benefit: decrease
- What a trial would measure
- Scored over 0-24 h after the dose. Best cohort: Obese, men only, 25-45 y, averaged over its single protein.
| Protein | Wanted | Scored at | Normal | Overweight | Obese | Obese F | Obese M | Obese 46-65 |
|---|---|---|---|---|---|---|---|---|
| ACC1 | inhibit | blood reaching the liver | 1.00 | 0.96 | 0.97 | 0.79 | 1.06 | 0.95 |
Table. Each cohort column is that protein's engagement relative to the reference cohort, which is 1.00 by construction; bold marks the strongest of the other five. The proteins act in different places, so their columns are read down and never averaged across.
Not scored here: PPAR-delta. Sits in a mechanism that feeds this endpoint but has no human evidence tying the receptor itself to this measure, so it is reported under its mechanism rather than counted in the cohort standing.
Inside One Endpoint: After-Meal Blood Sugar
This endpoint resolves into four proteins acting in three different places: the incretin-degrading enzyme DPP-4 in blood, the GLP-1 receptor on pancreatic tissue, and the glucose transporter SGLT1 and the lipid receptor GPR119 on the gut surface. Their raw scores are never pooled, because a score at an organ or gut site is a relative quantity rather than an absolute level. Each protein's cohort-to-reference ratio divides that out, so the cohort standing below is the average of all four ratios rather than any one protein.
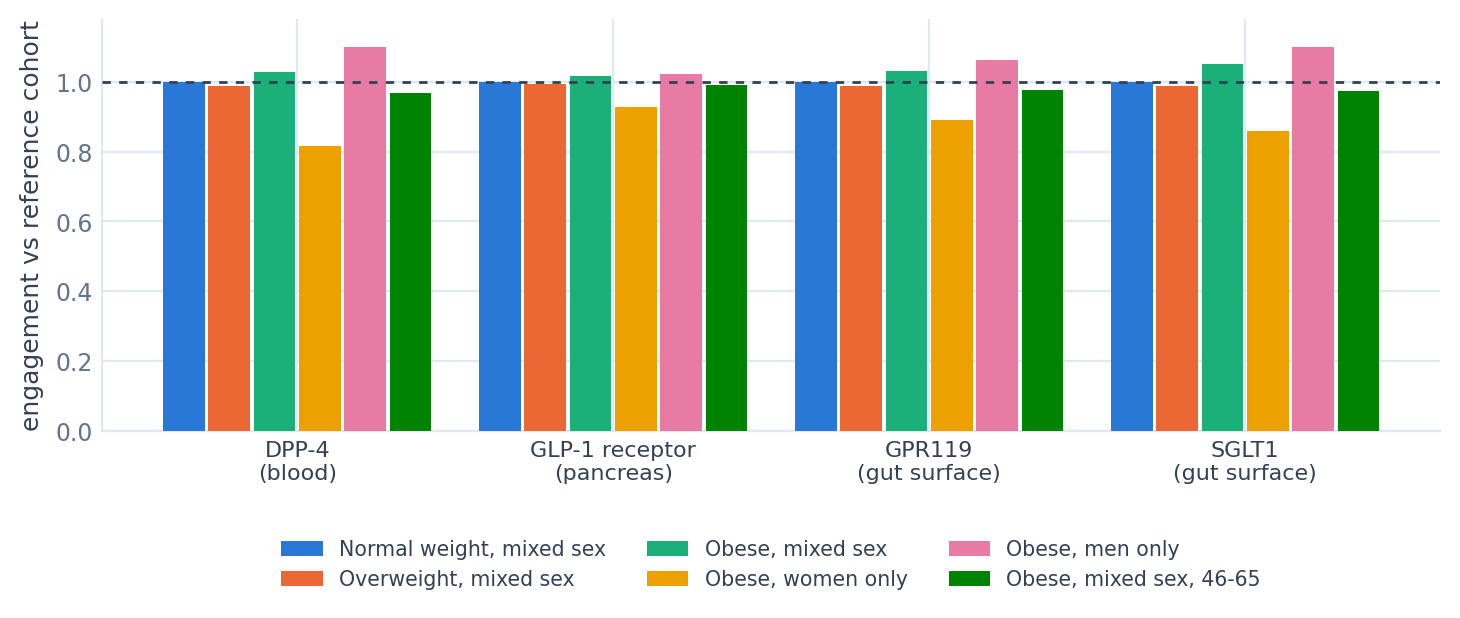
Figure 2. The four proteins behind after-meal blood sugar, each cohort relative to the reference cohort. They act in three different places, which is why the endpoint is read protein by protein rather than pooled into a single number.
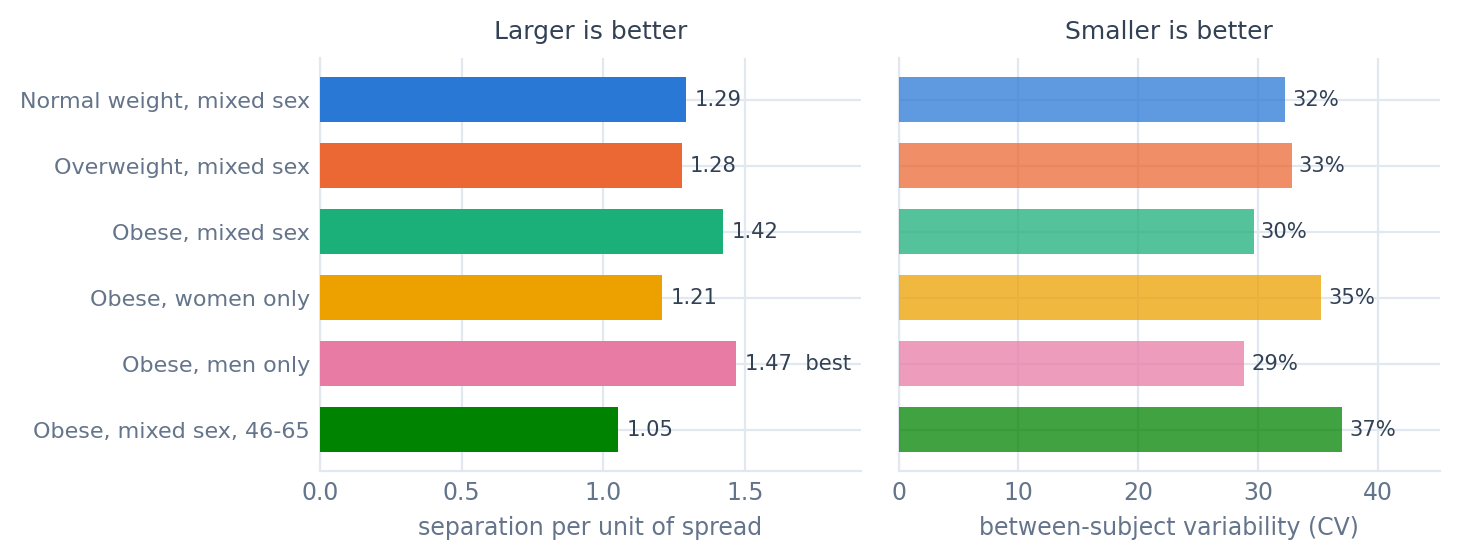
Figure 3. Left: how far the formula separates from its comparator per unit of between-subject spread, on DPP-4. Right: the spread itself. Obese, men only, 25-45 y leads on the left, and the cohorts carrying the widest spread on the right are the ones that need the most participants.
What The Cohort-Size Index Means
Everything in this section is read on one endpoint, after-meal blood sugar, averaged across the 4 proteins it scores.
- The equation
- Subjects needed per arm is proportional to 1 / d², where d is the difference between the two arms divided by how much
subjects vary.
Dividing one cohort by the reference cohort cancels the significance level, the power and the design constant, and leaves: relative cohort size = (d of the reference cohort / d of this cohort)²
A bigger separation, or a tighter cohort, means fewer subjects. Below 1.00 is fewer than the reference cohort would need;
above 1.00 is more.
| Cohort | Relative cohort size |
|---|---|
| Normal weight, mixed sex, 25-45 y | 1.00 |
| Overweight, mixed sex, 25-45 y | 0.97 |
| Obese, mixed sex, 25-45 y | 0.95 |
| Obese, women only, 25-45 y | 1.03 |
| Obese, men only, 25-45 y | 0.83 |
| Obese, mixed sex, 46-65 y | 1.52 |
Table. Each protein gives its own figure and the value shown is their average, so no single protein decides it.
How Hard Each Cohort Is To Recruit
A cohort that reads well on paper is worth little if a site cannot fill it. The candidates that must be screened to randomise one subject vary by an order of magnitude across these six, so this belongs beside the endpoint ranking in an enrolment decision rather than after it.
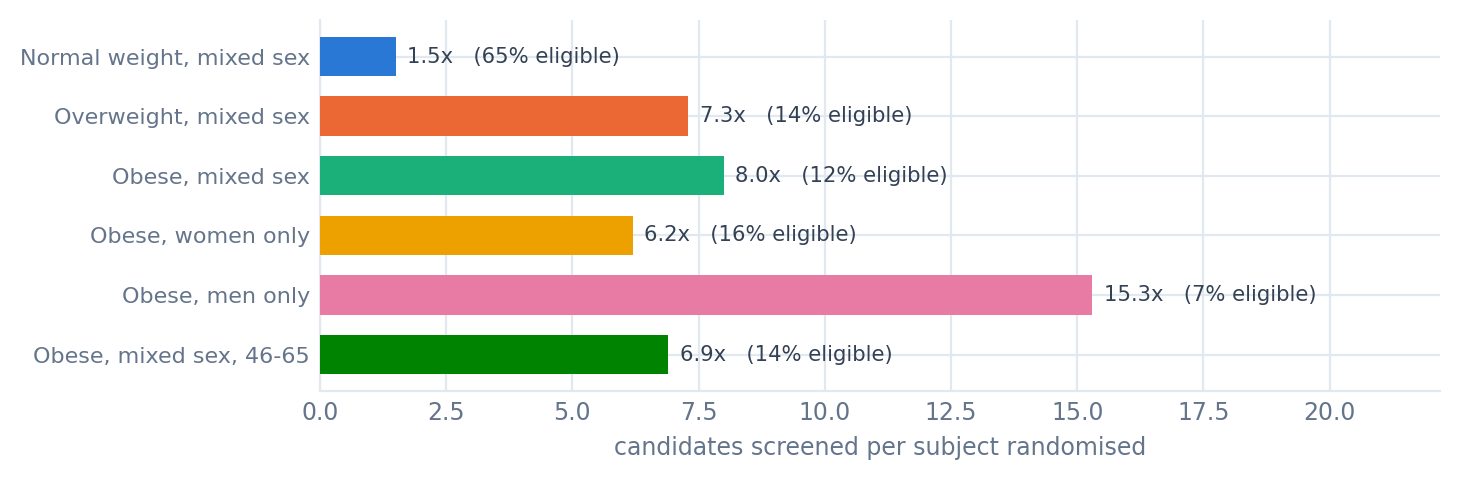
Figure 5. Candidates screened per subject randomised. Obese, men only, 25-45 y is 2.5 times scarcer than obese, women only, 25-45 y at the identical BMI band, and 10.2 times scarcer than the reference cohort.
A sex-stratified design that treats those two arms as equally fillable will finish one arm long before the other, which is a feasibility signal a site would otherwise discover at month three of enrolment. These figures come from a reference population and will differ with the lifestyle and body-size profile of the people a given site actually sees.
The Mechanisms Underneath
The same per-protein engagement, grouped by mechanism rather than by clinical measure. An endpoint above never introduces a new number for a protein; it re-weights these for one clinical question, which is why each row names the endpoint it feeds.
| Mechanism | Proteins | Feeds which endpoint | Best cohort | Worst cohort |
|---|---|---|---|---|
| Enteroendocrine satiety signalling | FFAR2, TGR5, GPR119 | After-meal blood sugar | Normal weight, mixed sex | Obese, mixed sex, 46-65 |
| Intestinal glucose uptake | SGLT1 | After-meal blood sugar | Normal weight, mixed sex | Obese, mixed sex, 46-65 |
| Incretin amplification | DPP-4, GLP-1 receptor | Appetite and fullness; After-meal blood sugar | Obese, men only | Obese, women only |
| Endocannabinoid appetite drive | Cannabinoid CB1 | Appetite and fullness (against) | Obese, men only | Obese, women only |
| Fat oxidation signalling | ACC1, PPAR-delta | Fat stored in the liver | Obese, men only | Obese, women only |
| Muscle protein breakdown restraint | Atrogin-1 | mechanism only | Obese, men only | Obese, mixed sex, 46-65 |
| Nutrient-stimulated insulin secretion | FFAR1 | mechanism only | Normal weight, mixed sex | Obese, mixed sex, 46-65 |
Table. Mechanism axes scored in every cohort, grouped by the endpoint they serve. A protein in bold is one that carries the named clinical endpoint; the others sit in the same mechanism but have no graded human evidence for that measure, which is why they do not appear in the endpoint table. 2 of 7 axes feed no scored clinical endpoint at all, so those rows are exploratory rather than predictive. Rows are read independently and never summed.
- Liabilities, reported per target
- A trial cohort is also a safety cohort. These are reported target by target and never averaged with anything: they are
independent liabilities, and for these rows a larger value is a worse result, not a better one. Enzyme inhibition flags the potential to raise levels of co-medication, which matters most in the older cohort where background prescribing is highest;
hERG flags heart-rhythm liability.
| Protein | Wanted | Scored at | Normal | Overweight | Obese | Obese F | Obese M | Obese 46-65 |
|---|---|---|---|---|---|---|---|---|
| hERG | avoid | free level in blood | 1.00 | 0.97 | 1.00 | 0.82 | 1.08 | 0.97 |
| CYP2C9 | avoid | blood reaching the liver | 1.00 | 0.97 | 0.98 | 0.82 | 1.05 | 0.96 |
| CYP3A4 | avoid | blood reaching the liver | 1.00 | 0.97 | 0.97 | 0.79 | 1.07 | 0.95 |
Table. Each cohort column is engagement relative to the reference cohort. Lower is better. No cohort is marked best, because none of these is a benefit.
Supporting Detail: Exposure
Bioavailability of each marker in each cohort, as a ratio to the reference. This is where a population first shows up in the data, before any pharmacology. It belongs underneath the endpoints rather than beside them, because absorption and target engagement do not rank the cohorts in the same order.
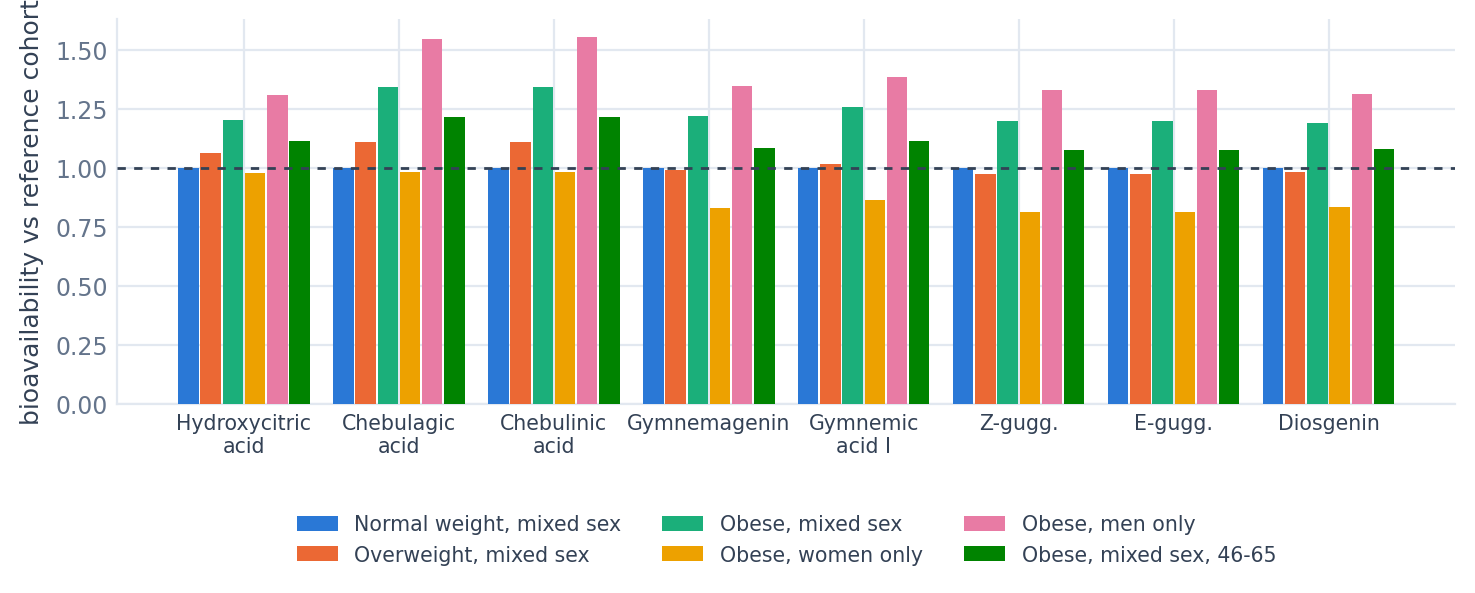
Figure 4. Modelled bioavailability of each simulated marker, each cohort relative to the reference.
| Cohort | Bioavailability vs reference | DPP-4 engagement vs reference | Mean weight kg |
|---|---|---|---|
| Normal weight, mixed sex, 25-45 y | 1.00 | 1.00 | 55.3 |
| Overweight, mixed sex, 25-45 y | 1.06 | 0.99 | 62.7 |
| Obese, mixed sex, 25-45 y | 1.20 | 1.03 | 70.3 |
| Obese, women only, 25-45 y | 0.98 | 0.82 | 65.6 |
| Obese, men only, 25-45 y | 1.31 | 1.10 | 76.6 |
| Obese, mixed sex, 46-65 y | 1.11 | 0.97 | 69.2 |
Table. Hydroxycitric acid, the dominant marker, against the endpoint it feeds. The two columns do not move together and neither follows body weight.
Absorption of the dominant marker runs from 2 per cent below the reference cohort to 31 per cent above it, while target engagement runs from 18 per cent below to 10 per cent above. Engagement tracks the concentration reached almost exactly; what it does not track is the fraction absorbed, because a larger body dilutes the same absorbed dose. Body weight alone does not settle it either: obese, women only, 25-45 y averages 65.6 kg and shows the lowest engagement of the six, while obese, men only, 25-45 y averages 76.6 kg and the highest. More distribution volume is the obvious explanation and evidently not the whole one; the mechanism has not been isolated and is not asserted here.
The practical reading is the useful part. A fixed label dose does not deliver equally across the people a weightmanagement product is sold to, the shortfall is not a simple function of how heavy they are, and no rule of thumb would have ordered these six cohorts correctly. That is the argument for settling a weight-banded dose or an enrichment criterion before the protocol is written rather than after a null result.
What These Numbers Support, And What They Do Not
What this study is for Every number in this report is a comparison between cohorts of the same formula on the same endpoint. Dose, formulation, particle size, potencies and the target panel are identical in every cohort, so whatever the model gets wrong it gets wrong equally everywhere and cancels when one cohort is divided by another. That is what makes the cohort ranking the output of this study, and it is a decision the simulation is built to support: which population to enrol, and which to avoid.
- The ranking is what transfers, not the magnitude. These are modelled R&D priors for trial design: not clinical efficacy, not a regulatory claim, and not an absolute effect size or subject count.
- A real trial also carries biological and measurement variance, and is dominated by adherence, placebo response, diet and exercise cointervention and dropout. None of that is in the model. It inflates the spread in every cohort rather than in one, so it compresses the differences reported here: the leading cohort stays the leading cohort, while the order among the trailing cohorts is, to some extent, less stable than the table implies.
- Central targets are scored on free blood levels as a stand-in, so the appetite axis cannot distinguish molecules by how well they cross into the brain.
- Where a manufacturer publishes no marker content, the assumption used is declared with the run and biased towards understating exposure. Understating exposure cannot manufacture a benefit.